| ||||||||||||||
| |
|
| ||
| ||||
|
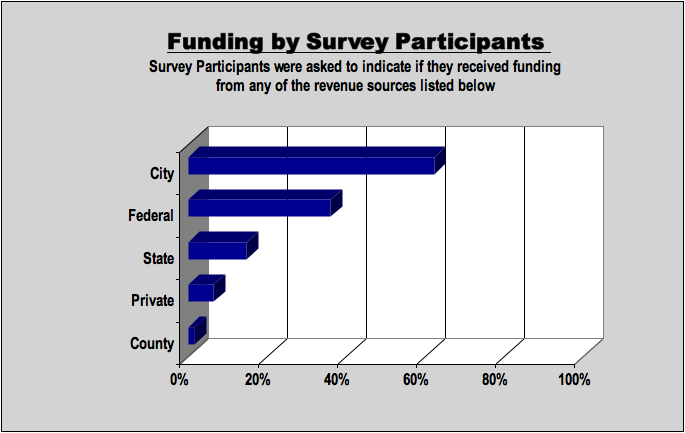
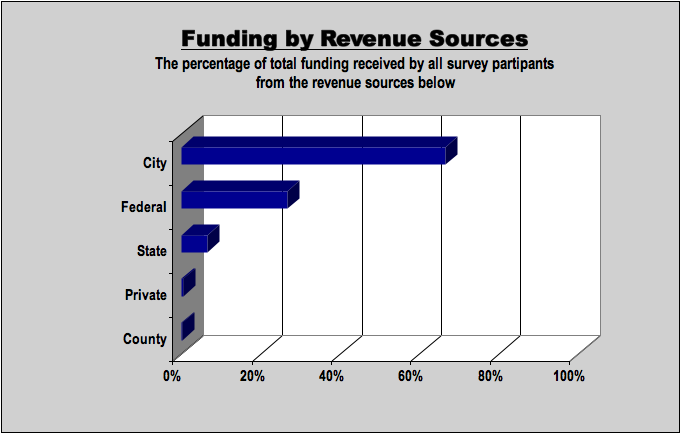
The chart on the left indicates that most — roughly 60 percent — of the surveyed programs receive funding from city sources, with about 30 percent receiving funding from the federal sources, 15 percent from state sources, and less than 10 percent form private sources. The chart on the right indicates that funding from city sources composes nearly two-thirds of the total revenue across all surveyed programs, with federal sources composing less than one-quarter of all revenue, state sources less than one-tenth, and private and county sources a negligible amount. A future survey could examine more closely the nature of these revenue streams and their impact on the governing structure and range of services provided by each program. Such examination would identify specific city, federal and state funding sources, look at how these sources correlate with the range of services and functional areas covered by each city's program, and identify common funding threads among programs across regions or the entire country. |
||||
|
|